Hi Coen
is it possible to explain how you computed the filter graph shown on the webpage
http://www.biosemi.com/faq/adjust_filter.htm
(of course not in detail)
What unfilterd Powerspectrum-behavior of the EEG-data did you assume? 1/f-noise?
I'm just asking beause I don't recieve the same filter behavior results for my measured data as shown in your graph.
Thanks a lot
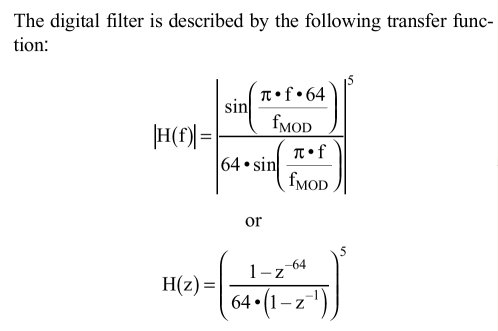
hardware bandwidth limit
Please see this picture, that explains it all.
http://www.biosemi.com/pics/transfer.jpg
Best regards, Robert(Biosemi)
http://www.biosemi.com/pics/transfer.jpg
Best regards, Robert(Biosemi)